


**A Top Downloaded Medical App - Over 500,000 Installs**
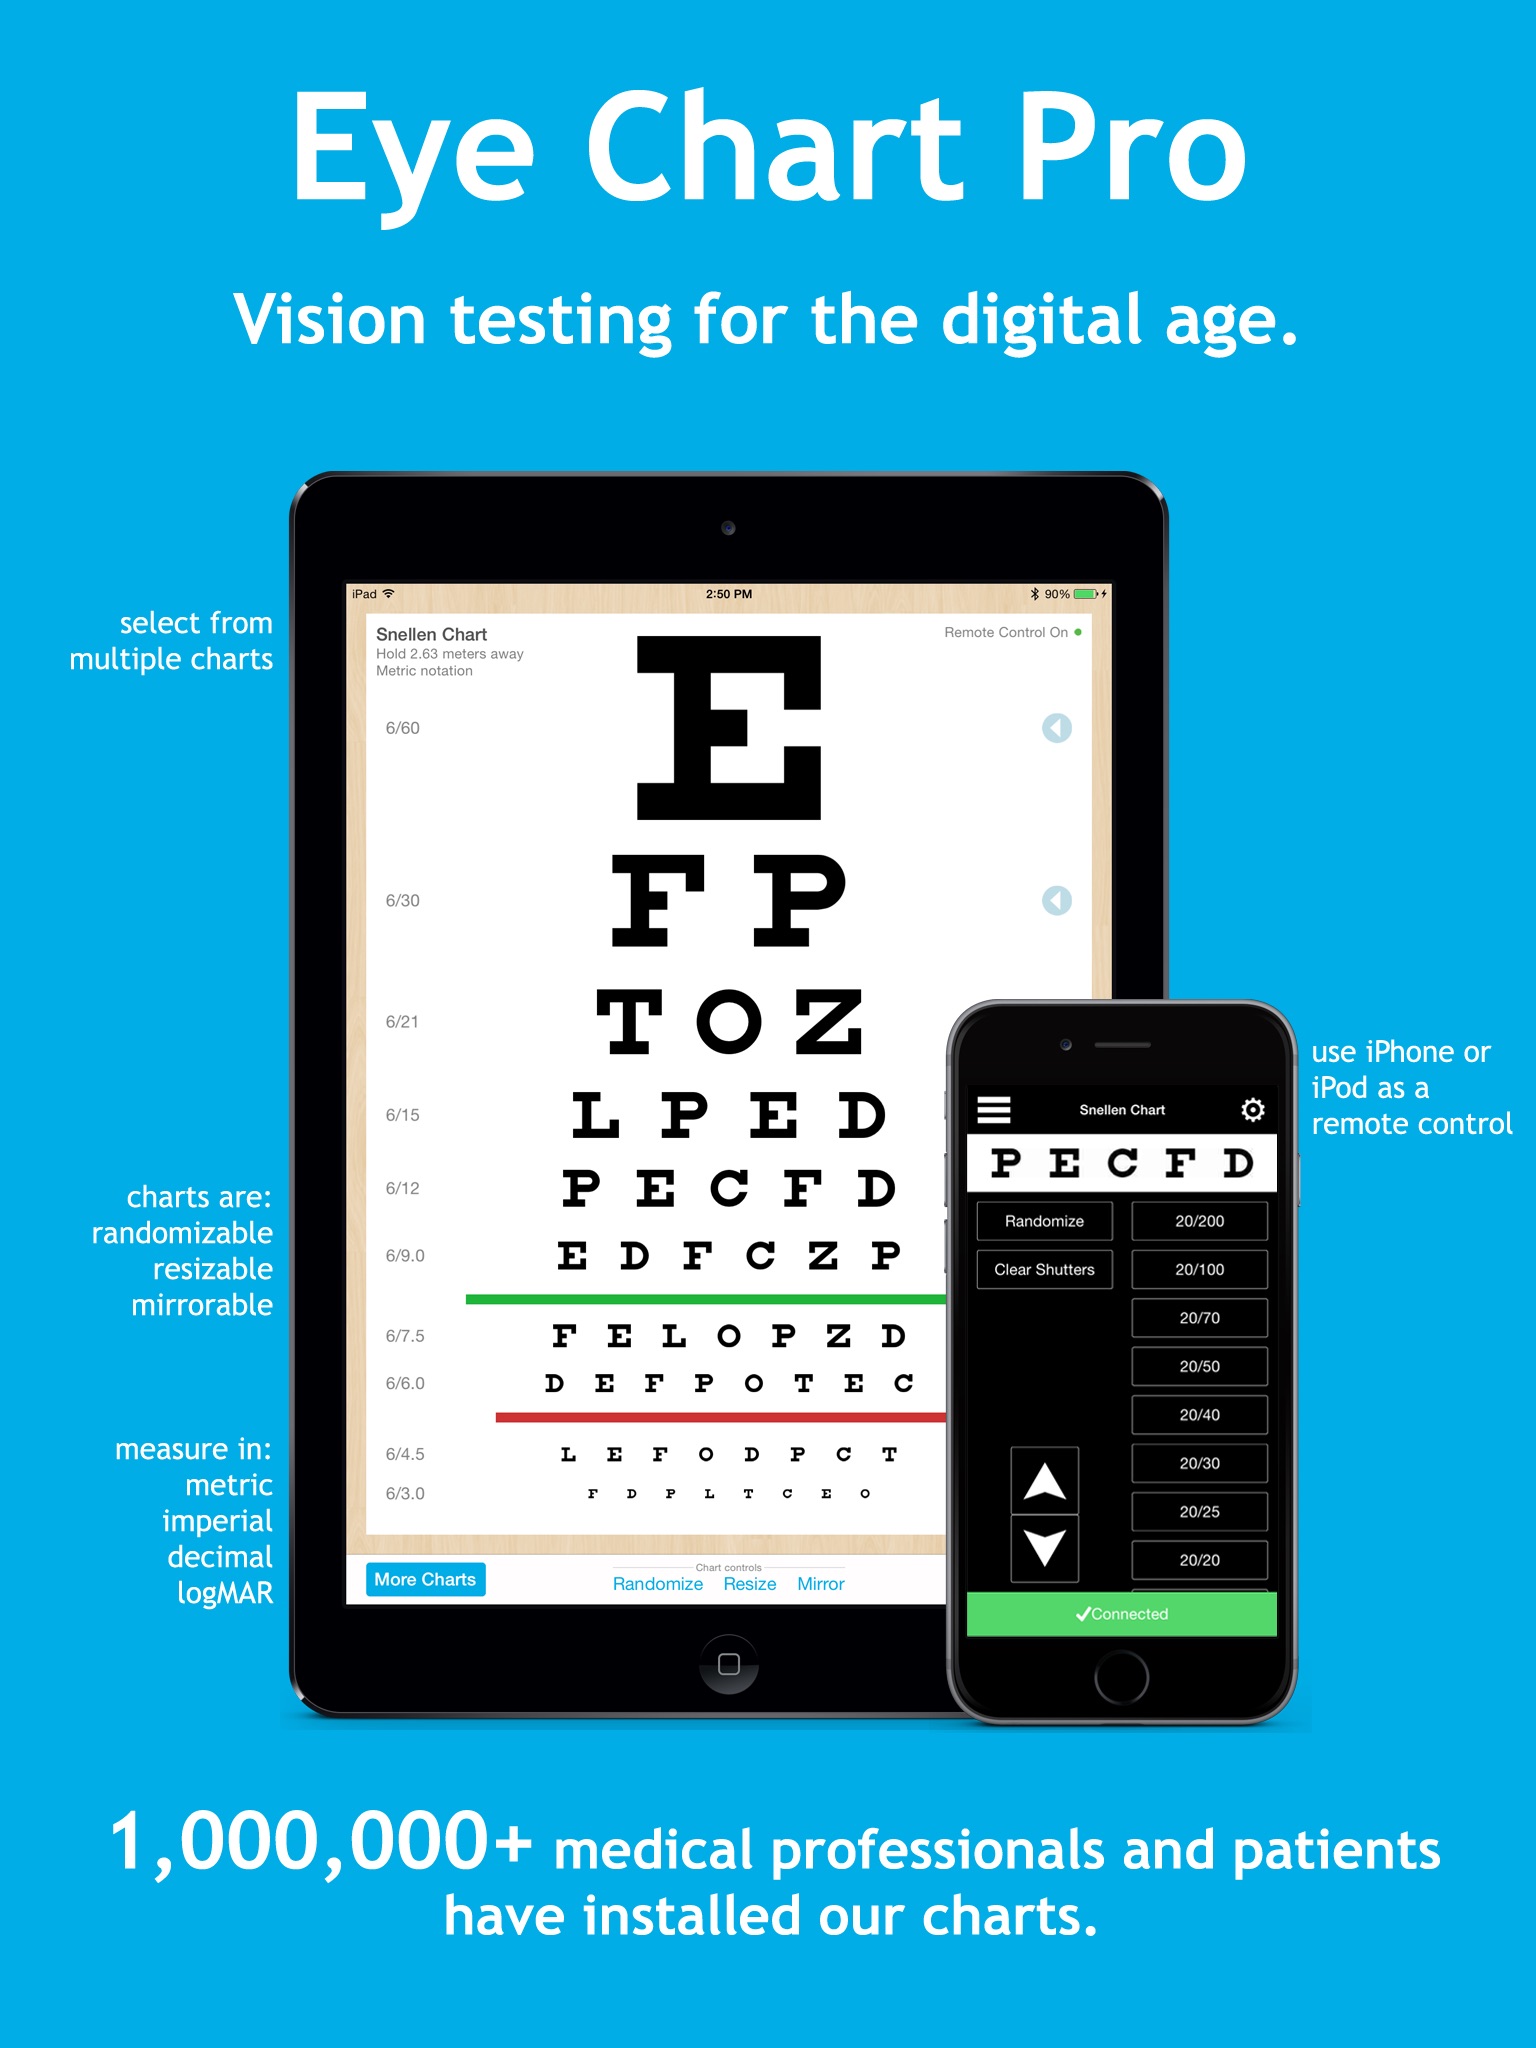
Eye Chart Pro is a clinically-reviewed, randomizable visual acuity exam. It’s remote-controlled, pleasant for patients and providers, and FREE. Similar chart projector functionality usually costs over $1000. Check out the last screenshot to see more information on the clinical reviews in peer-reviewed publications and their conclusions.
Useful for:
- Triaging
- House visits
- Patients who have memorized the office chart
Features:
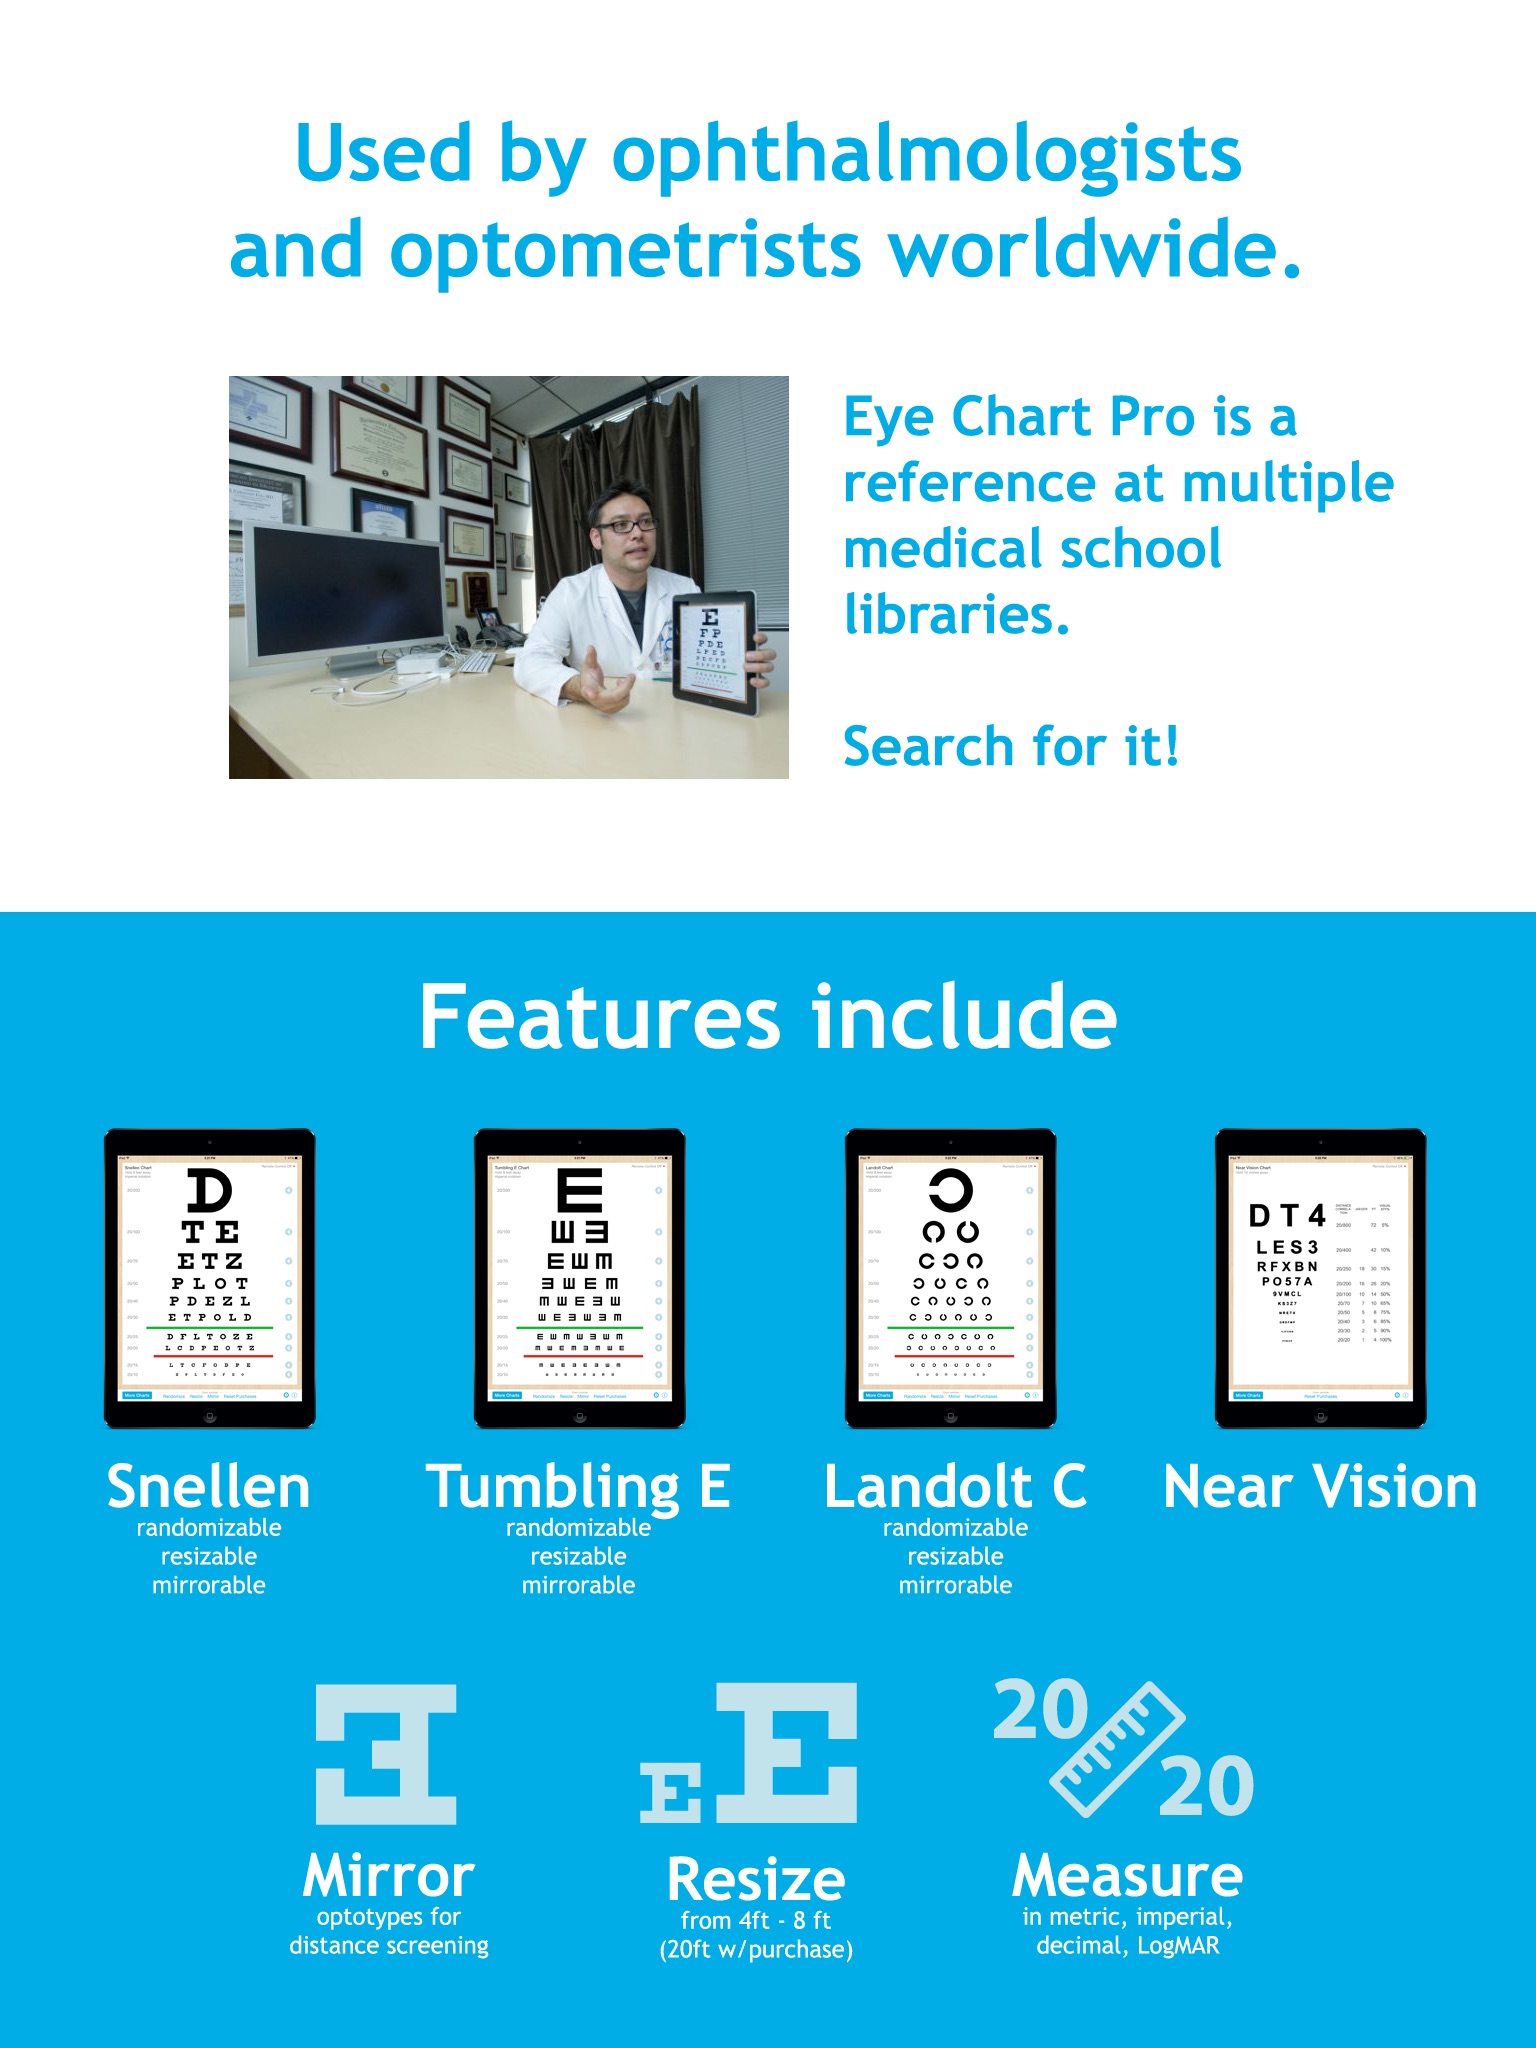
- Randomizable Snellen Chart
- Randomizable Tumbling E Chart
- Randomize the whole chart or one line at a time
- Smooth interface with animations
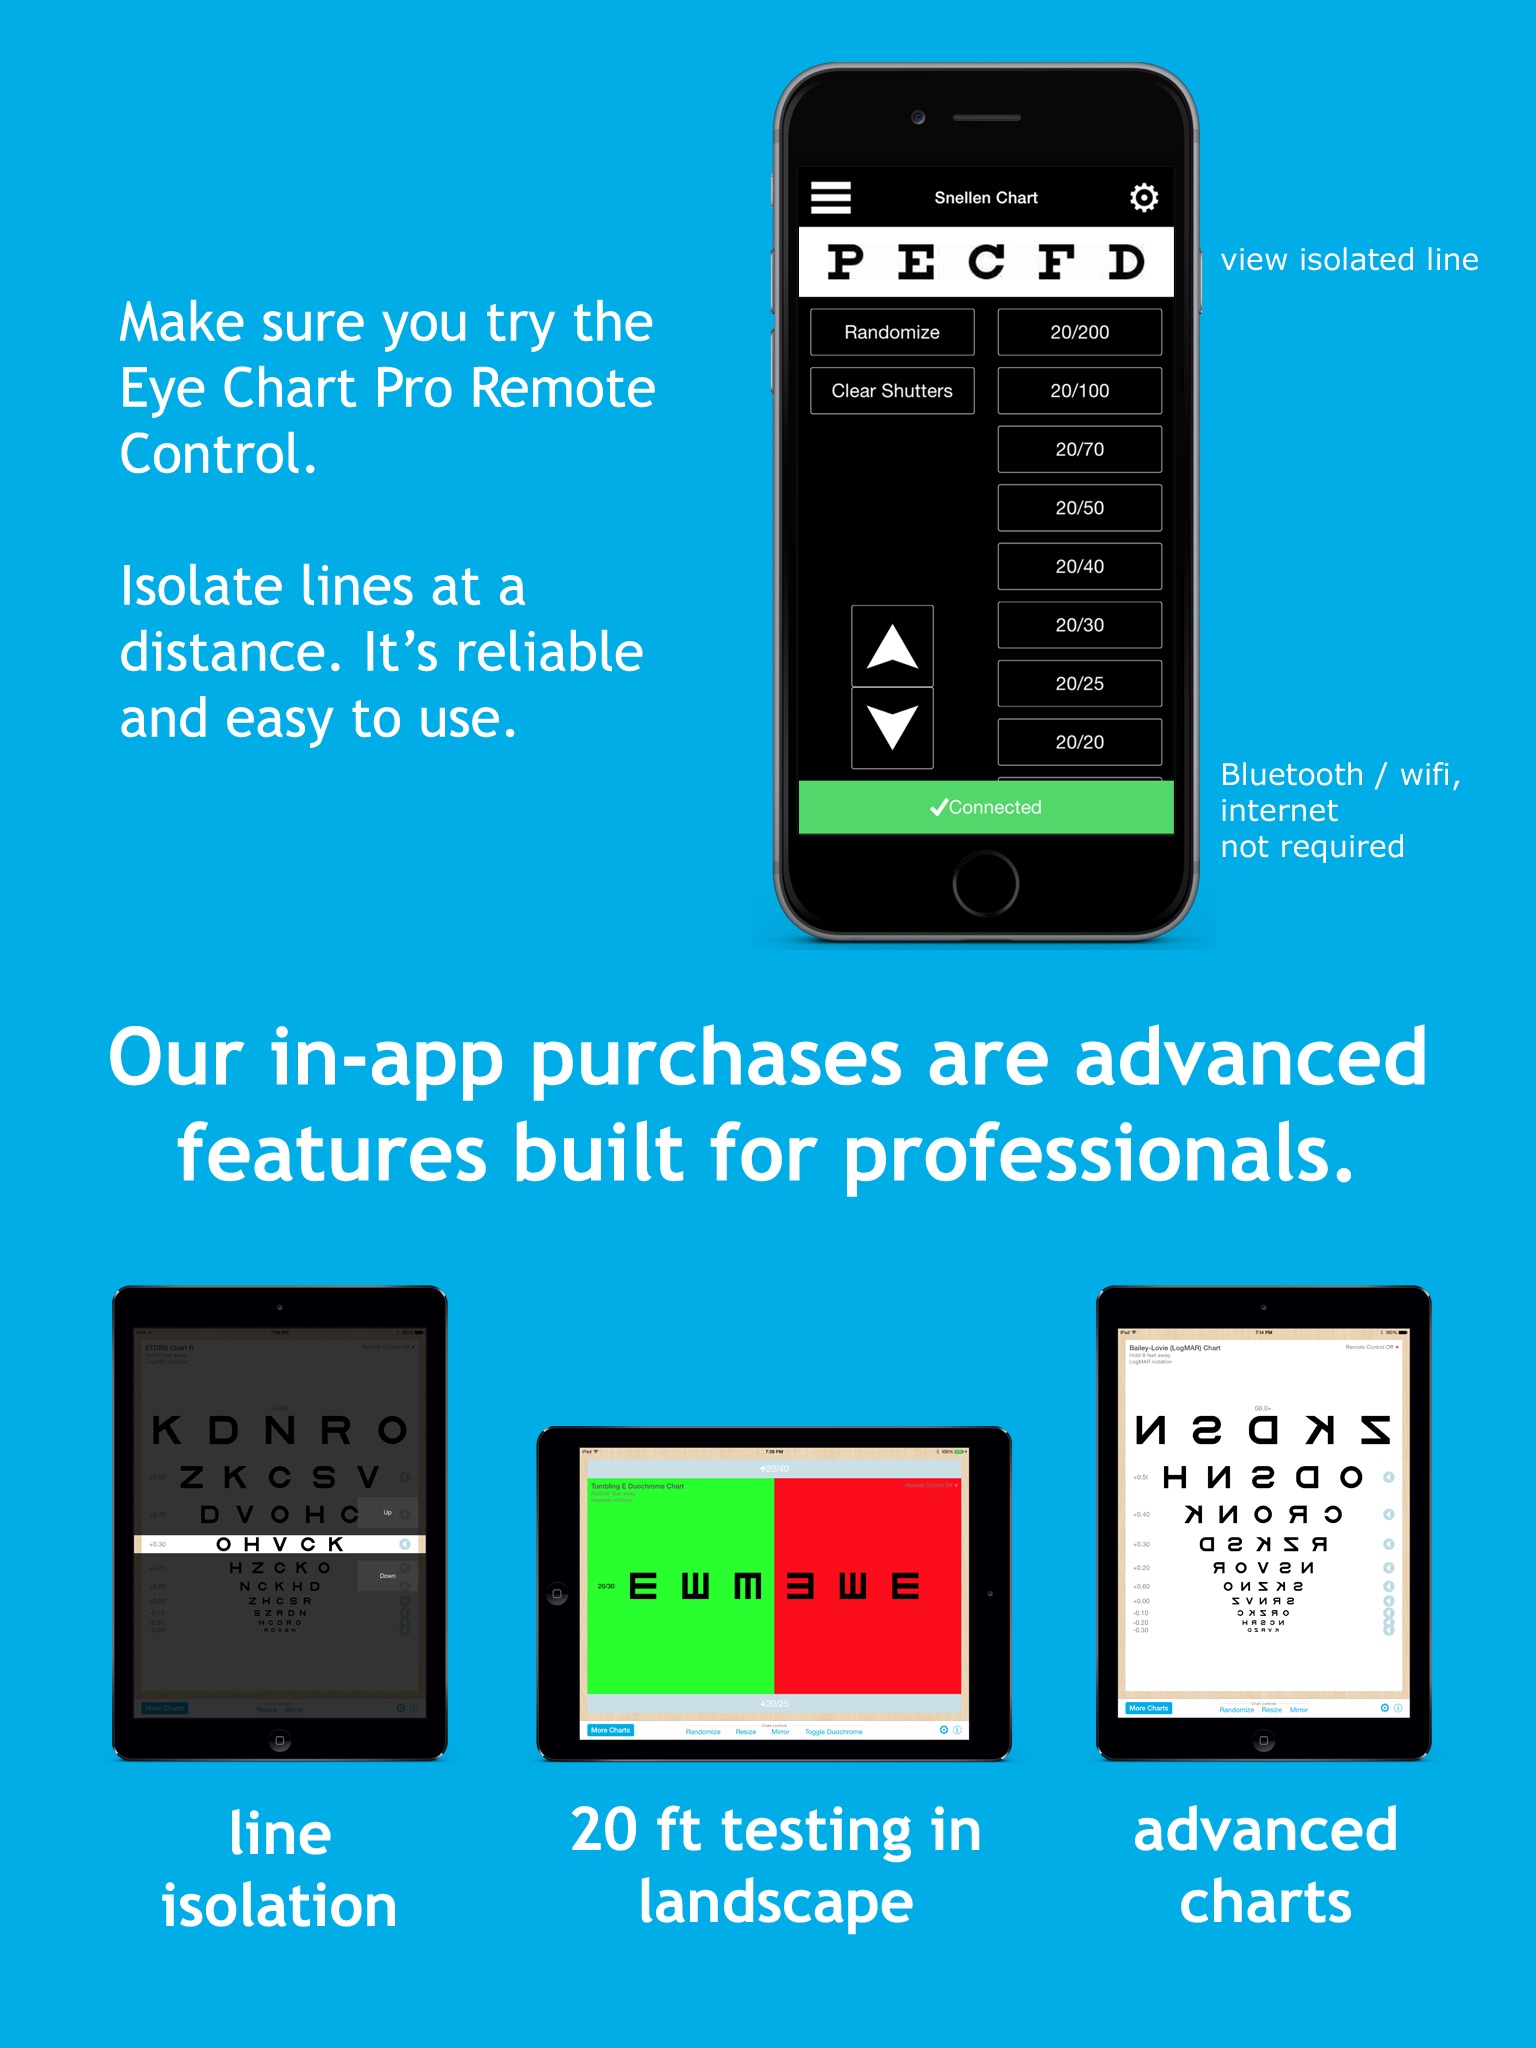
- Basic remote
- Metric / Feet functionality
Description:
Eye Chart Pro is a generator for randomized Snellen and Tumbling E charts to offer a rough but useful screen of visual acuity. Simply press a button to randomize the entire eye chart, or touch an individual line of the chart to randomize that line. Tap another button to toggle between Snellen and Tumbling E charts.
Eye care professionals around the world use Snellen Eye Charts to measure visual acuity. However, patients often memorize the classic Snellen chart, leading to less accurate vision measurements. Enter Eye Chart Pro! Though this unique, notebook sized randomizable eye chart should not be used as a primary visual acuity measuring tool, it can provide a handy rough vision screen when a chart is not available, or it can be used to complement static, wall-based Snellen charts.
Eye Chart Pro was made with the best of intentions, and we hope to continue improving it. Your feedback is appreciated!
Here is a summary of clinical evaluations we have found:
ETDRS Chart on Eye Chart Pro on iPad: “Validation of the visual acuity iPad app Eye Chart Pro compared to the standard Early Treatment Diabetic Retinopathy Study chart in a low-vision population” Journal of Telemedicine and Telecare.
Conclusion (summary quote): “The ETDRS chart function on the Eye Chart Pro application can reliably measure VA across a range, from normally sighted patients to those with low vision.”
Sloan Chart on Eye Chart Pro on iPad: “The validity of visual acuity assessment using mobile technology devices in the primary care setting.” Australian Family Physician.
Conclusion (summary quote): “The high level of agreement of visual acuity results between the Snellen wall chart and both mobile technology devices suggests that clinicians can use this technology with confidence in the primary care setting.”
Tumbling E Chart on Eye Chart Pro on iPad: “A Pilot Trial of the Ipad Tablet Computer as a Portable Device for Visual Acuity Testing” Journal of Telemedicine and Telecare.
Conclusion (summary quote): “Bland-Altman analysis revealed a mean difference (bias) of 0.02 logMAR units between the VA results from the iPad chart and the light-box chart, with 95% limits of agreement of -0.14 to 0.19.”
We are not responsible for the above studies, so please check out the papers above if you have further questions.